Despite optimisations we explored in my previous post, there are still many obstructions to achieving free-threading performance.
One specific issue is that: often benign code abstractions can hurt multi-threading performance. This is something we explored a while ago in How free are threads in Python now?:
The following code end up being a bottleneck, as we had to lock the grid object each time we call __getitem__. This turns out to be many times slower than accessing the underlying tuples directly. And the result is true in even the latest version of Python 3.15.0a6t (what a mouthful!)
class Grid:
    tiles: tuple[tuple[bool, ...], ...]
    ...

    def __getitem__(self, key: Pair) -> bool:
        return self.tiles[key[0]][key[1]]
Python is a multi-discipline language but OOP is certainly encouraged, so it's the abstraction I made here is considered 'Pythonic' by normal standards. This creates a disconnect where the best practices would differ based on whether the code is expected to run in a thread or not.
This suggests that Python is missing some optimisations to facilitate abstraction without loss of multithreading performance.
Worst still, there were no real way to debug performance issues like this, profilers didn't really support free-threading, and the process just involved a lot of guess work.
Enter Tachyon
Thankfully, this is all about to change in 3.15 with the introduction of Tachyon a sampling profiler.
The new profiler sports a host of features:
- Low overhead
- Remotely attachable
- Supports many different output formats
- Async aware
But most importantly, native support for multiple threads. I ran my original abstracted version of my code with the profiler:
sudo -E uv run -p 3.15.0a6t python -m profiling.sampling run -a --flamegraph -o profile.html -r 20khz d6.py
Noting the following:
- sudo is needed on MacOS
- Since the profiler is a sampling profiler, we can specify a sampling rate of 20kHz (20,000 times a second)
- We're producing a flamegraph in this case, but there're many other options available.
-ais required to profile all threads, only the main thread is profiled by default.
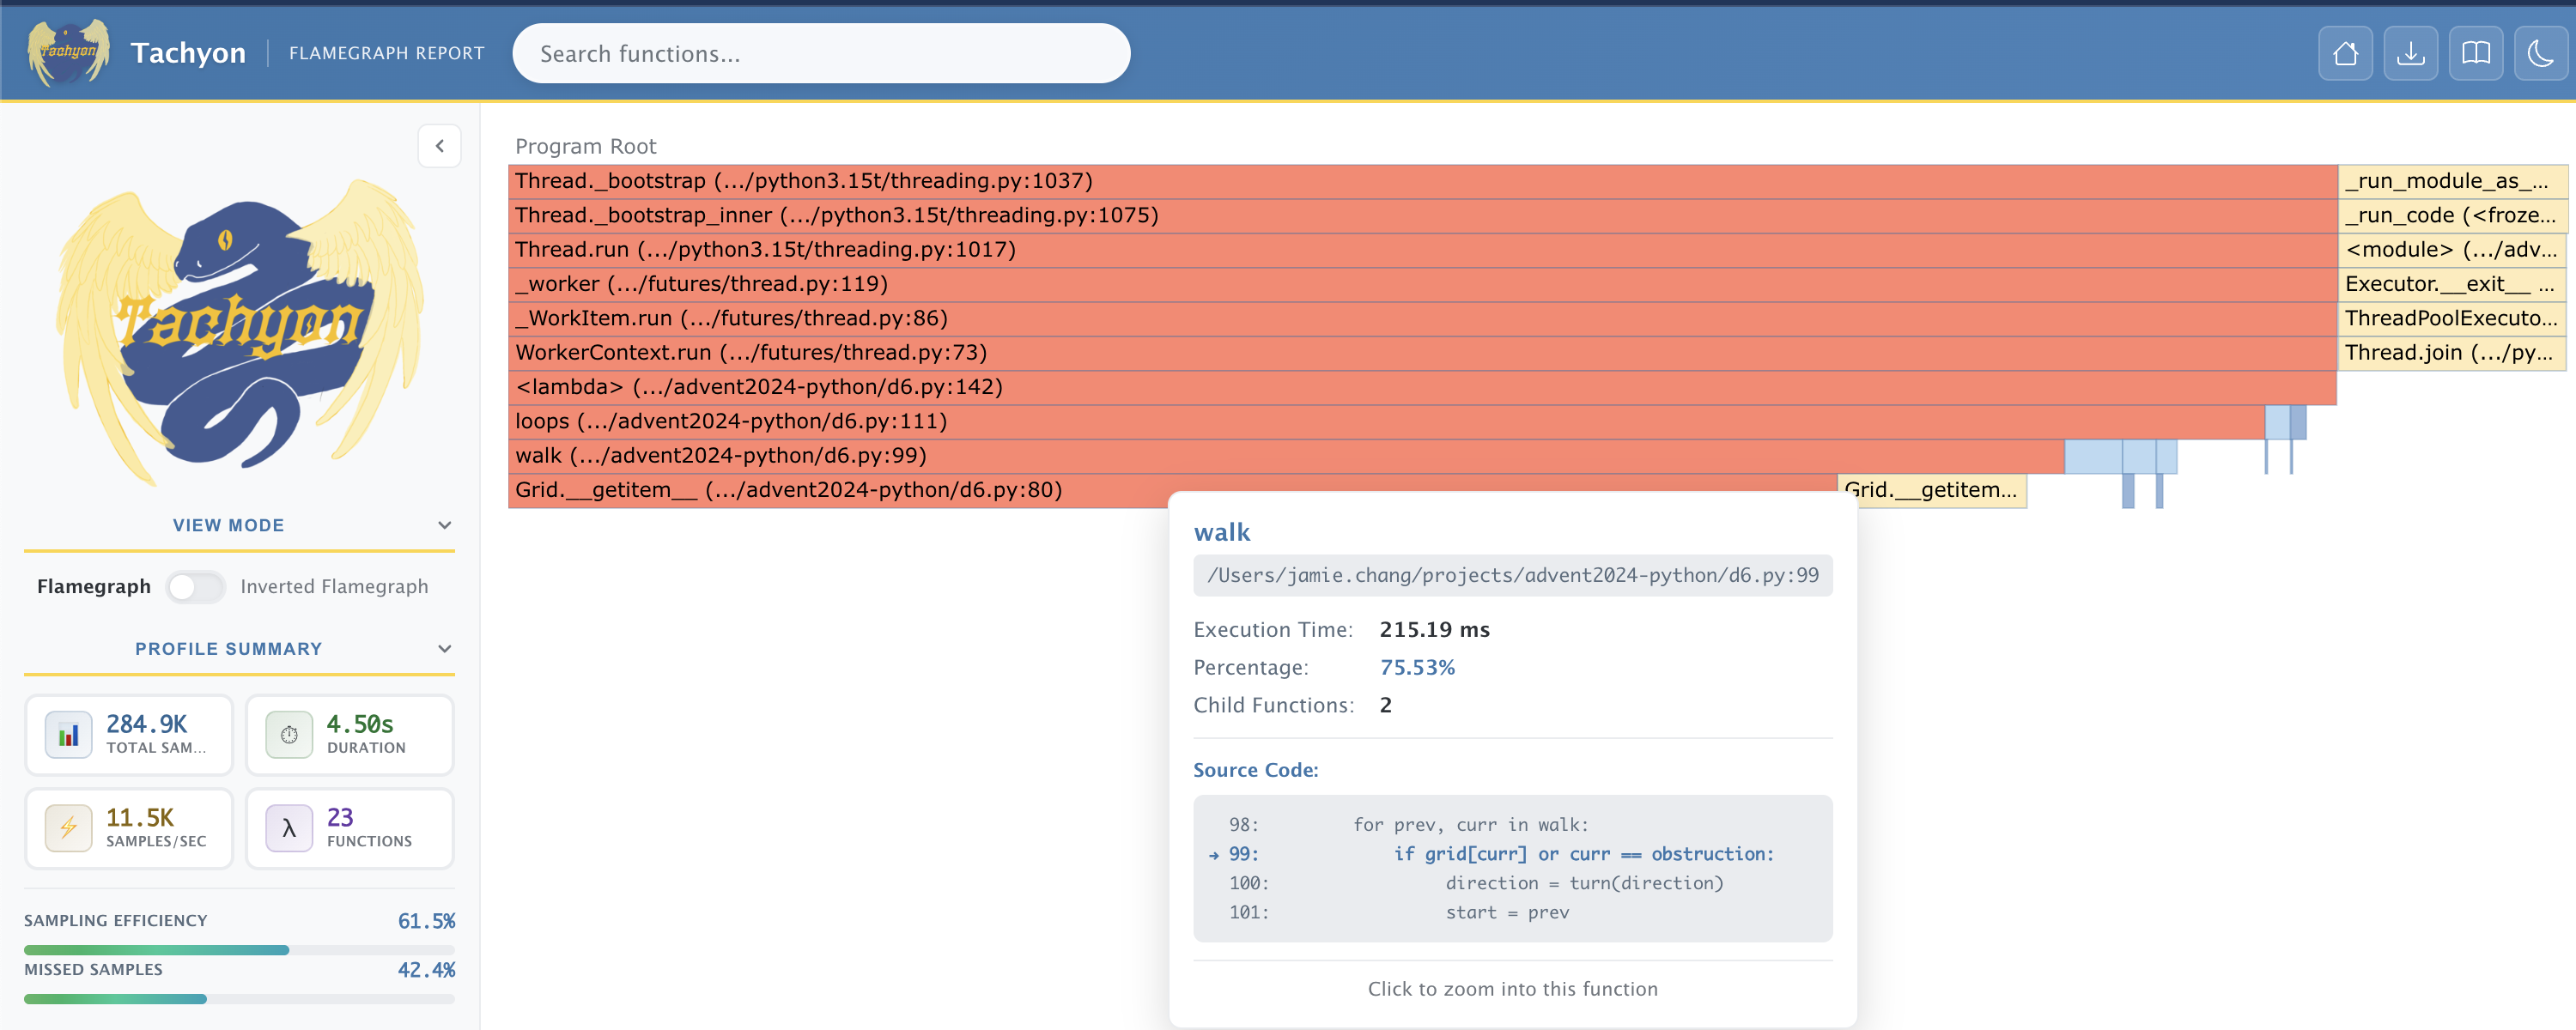
We can see that the flame graph shows big columns of red, the red colour signals a hot path, where the code spends the most amount of time.
In particular 75% of the time is spend on the line that accesses grid via __getitem__:
if grid[curr] or curr == obstruction:
Generally some hot paths are expected, but this single line taking up such a large proportion of time is unexpected. This gives us a good indication of where the problem might lie.
Verifying the fix
Now we already know the fix, we bypass the __getitem__ call and access the underlying tuples directly:
if tiles[r][c] or (r, c) == obstruction:
The results are as follows:
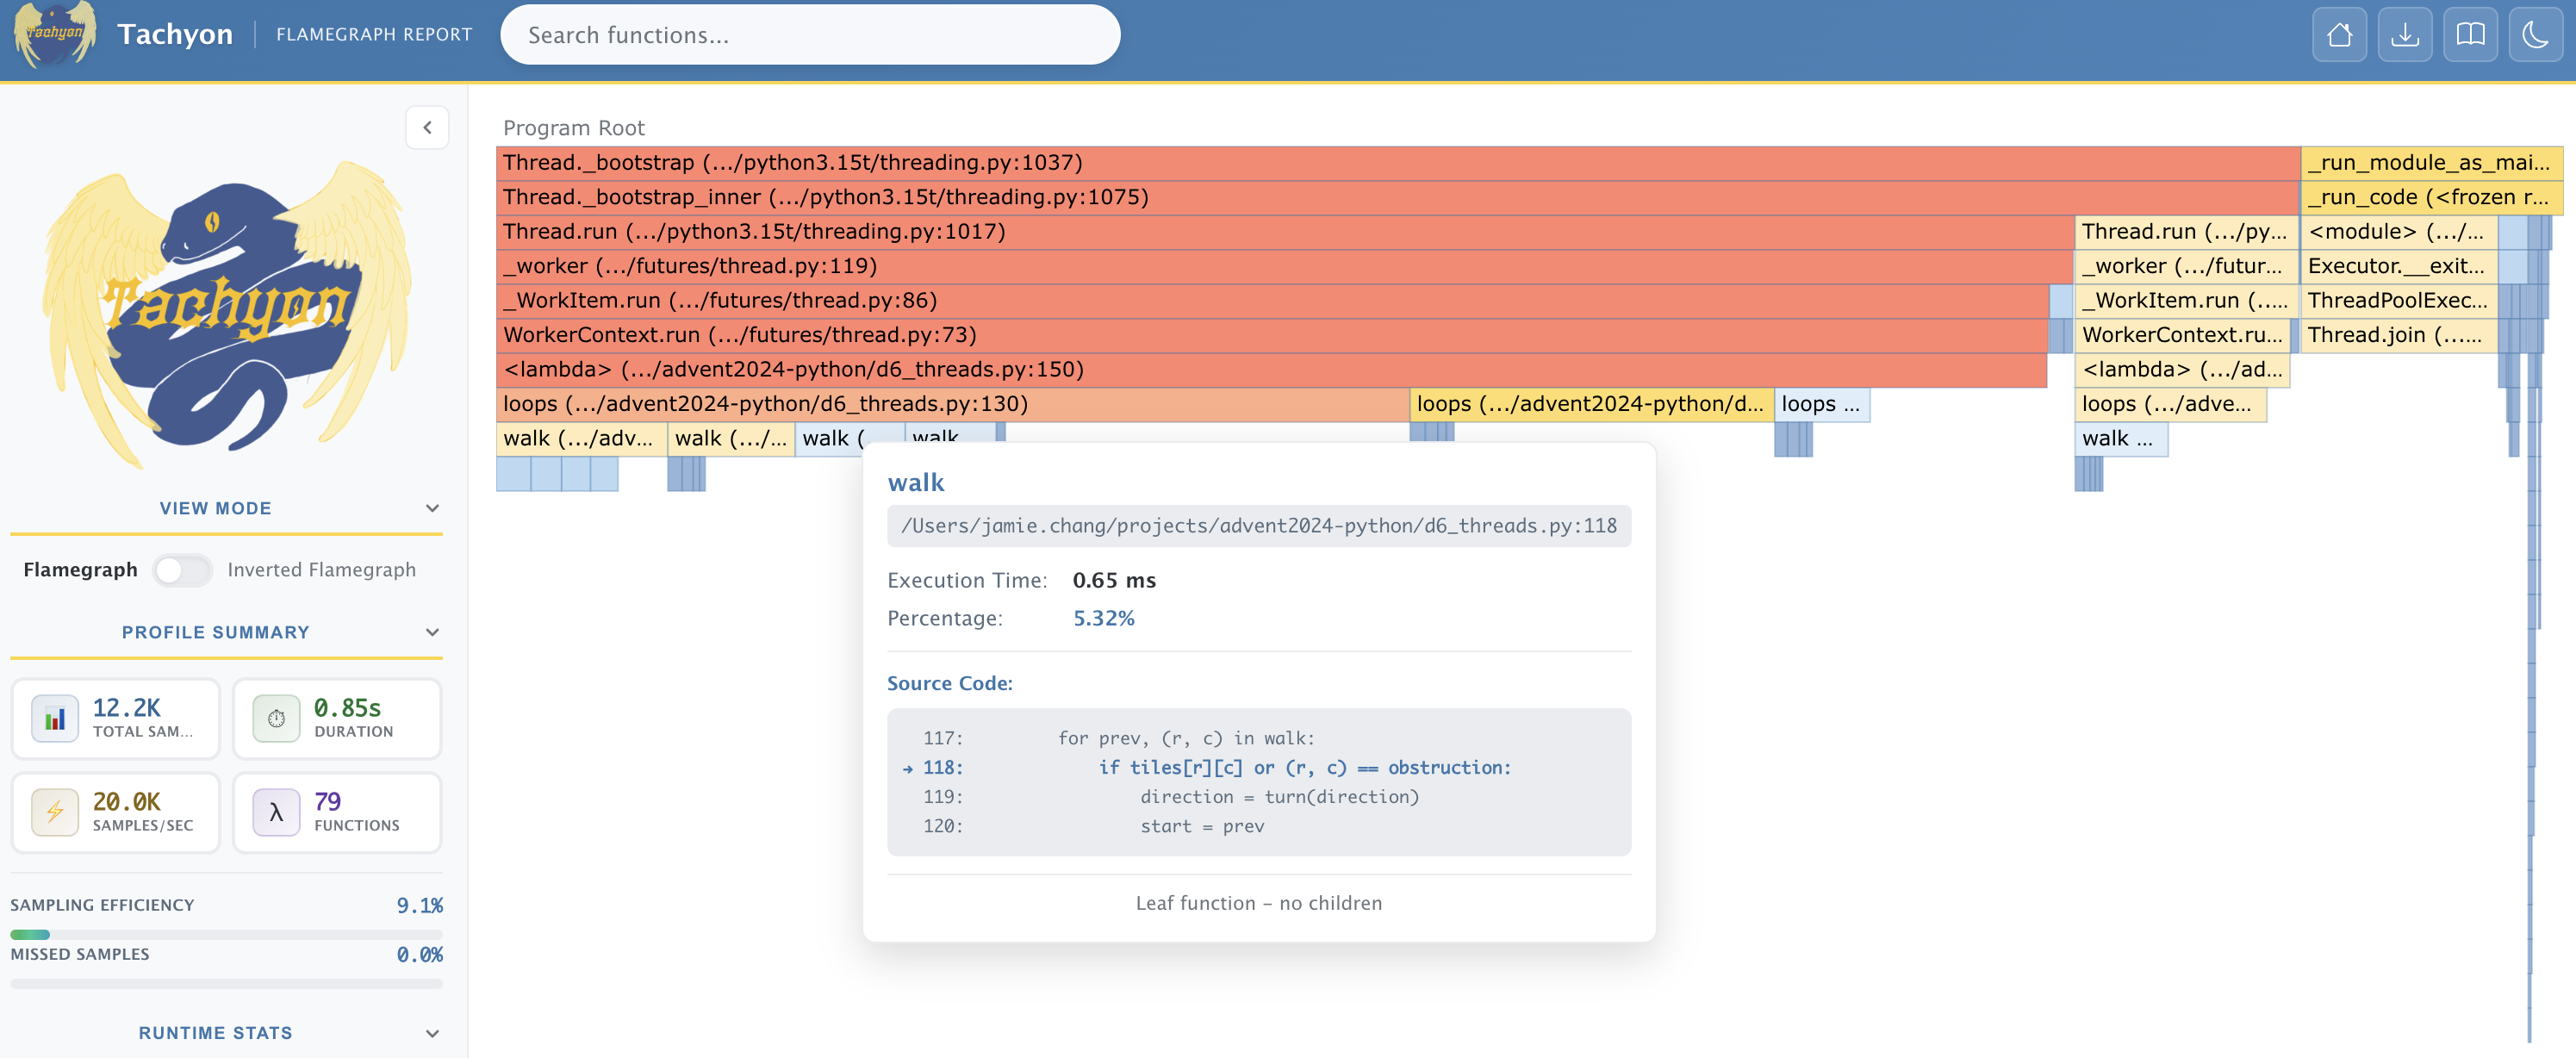
The new line, is now blue (cold path) and only takes up 5.32% of execution time. Indicating the bottleneck has now been eliminated.
Closing Thoughts
There's a lot more tachyon has to offer, and it's not only useful for free-threading, for example, I would love to try using it on an asyncio program.
What benchmarking provides is a path for normal developers to take advantage of free-threading and reason about performance. I think with this, we can expose and address more of these performance traps, and perhaps free-threading can become more natural for pure Python developers.